How to think about a football game.
How we decide who to favor in the biggest game of the season: exactly like we decide who to favor every other game.
As we head into the first Super Bowl week with Wolohan Analytics up and running, it is natural to want to cover the Super Bowl. But One of the things that I want to try and avoid is producing news-cycle centric content that.
Success happens over the long-term, not the short term. So if we focus on long-term events, we’ll be right more often than if we focus on short term events.
For example, our pre-season and Thanksgiving bets—futures and Super Bowl picks—were both in the money. Focusing on year-long trends over single-game events makes your life a lot easier.
So instead of focusing on this Super Bowl, and breaking it down, I want to write about how to break down a game—and use this Super Bowl as an example.
When we break down a game, we look at a handful of different things:
Elo Rating
EPA/60 plays
Points per game
P(100)
Betting rates
Elo Ratings
The Elo Rating system is an old system for evaluating chess players, that has since been adapted into just about every 1v1 context you can imagine. Anywhere that two individuals or teams face off directly, we can use Elo to estimate skill.
Traditionally, this value is represented as a number between 1000 and 3000. And that’s okay if you’re a math nerd. But for ease of football betting, we represent this value by its point-spread equivalent.
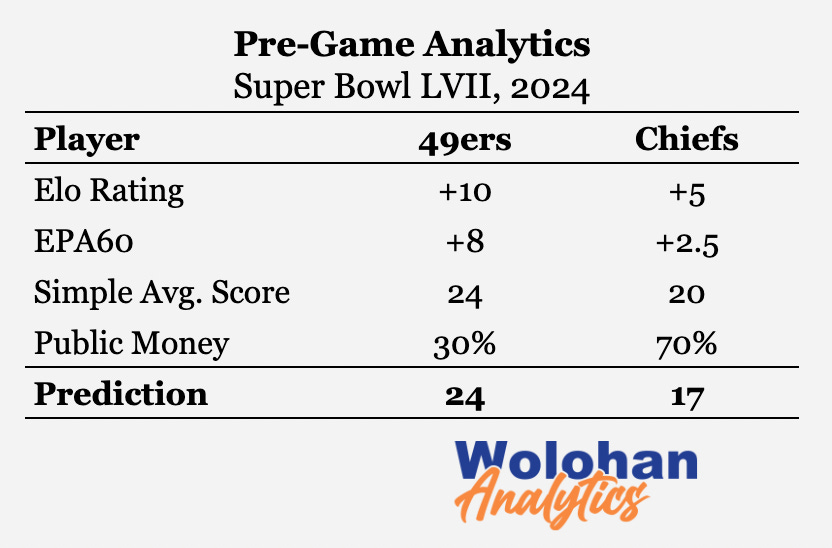
Over a league average team, the 49ers are about a +10 favorite, and the Chiefs are about a +5 favorite.
By Elo rating, the 49ers are a +5 favorite over the Chiefs.
EPA per 60 plays
Expected Points Added is a measure of how much better a team does, on each individual play, versus an average expected outcome—based on down, distance, game time remaining, etc. Better teams will have higher EPA than worse teams.
Many places will give you a per play rating, which is a simple average—because EPA is counted on a per play basis. We multiply this number by 60, to give you EPA per game.
Separately, we also calculate EPA per plays within the “middle 8” minutes of a game: the four minutes preceding and immediately following the half. This number reflects coaching skill and the general buttoned-upedness of a team.
San Francisco is 8 points better than average per game by EPA and the Chiefs are 2.5 points better than average.
By EPA per Game, San Francisco is a +5.5 favorite over Kansas City.
The Chiefs earn 2 points more than average in the middle eight and the 49ers earn 1 point more than average.
The Chiefs have a slight edge in the middle eight.
Points per Game
Points per game is probably the least sophisticated measure we use, but it is good to mix naive approaches with complex approaches. The naive approaches keep you from believing patently ridiculous things.
The way we use points per game is as follows: take the number of points scored and conceded by each team, divide by the number of games played. Create a 60/40 mixture of each team’s points scored and the other team’s points conceded, and use this to reflect a projected score.
For example: San Francisco scored 491 points in the regular season and Kansas City gave up 294. 60% of 491 divided by 17, plus 40% of 294 divided by 17, is about 24. So we would estimate that San Francisco should score around 24 points.
Points per game average suggests that San Francisco will beat Kansas City 24-20.
P(100)
P(100) is a house metric that evaluates the consistency and quality of a quarterback. Literally, it attempts to estimate how likely it is a quarterback will average a QB rating over 100 in a four game stretch.
Like the middle eight metric, we typically use this as a tie-breaker metric. If it looks like the line is set about right, we’ll favor the team with the more consistently good quarterback.
In this matchup, both quarterbacks are good. But Mahomes is trending up and Purdy is trending down. Mahomes has just played two of the best games of his season, and Purdy two of his worst, but Purdy still has a higher rating.
San Francisco’s quarterback has a higher P(100) (XX%) than Kansas City (XX%), and can therefore expect better quarterback play.
Betting Rates
Vegas’ lines are not a prediction of the game. Instead, they are a financial tool to maximize the amount of money that Vegas makes. Looking at where the public is betting, and line movement, can give us a sense of Vegas’ strategy around the line.
The line opened at -2.5 in favor of San Francisco and is now -1.5. The vast majority of the public money is on Kansas City.
Vegas thinks San Francisco should be more than a +1.5 point favorite.
The Public loves Kansas City.
Putting it all together
All our numerical measures have San Francisco beating Kansas City by between 4 and 5.5 points. Kansas City has a slight edge in our tie break metric: middle 8 EPA.
San Francisco should probably be a 3 point favorite or more.
Because of the consensus has Kansas City as 4 point dogs or worse, we should be happy to buy the line up until San Francisco -4. At San Francisco -2.5, we’re getting great value.
Patrick Mahomes’ heroics and a stout K.C. defense have the public riding high. This is reflected in all of the analysis of this game that I have heard or read.
Whenever we need heroics to justify bets, we’re in trouble.


